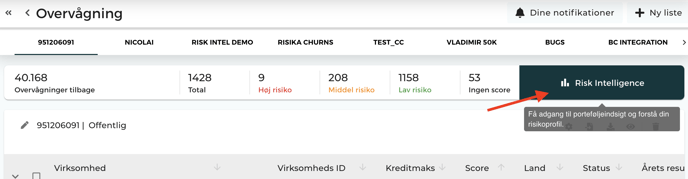
Once you have created your monitoring list, you can access the module directly from the desired list by clicking the Risk Insights button in the top right corner.
Haven't set up a monitoring list yet? You can read how to get started here: https://help.risika.dk/monitoring-setup
Overview
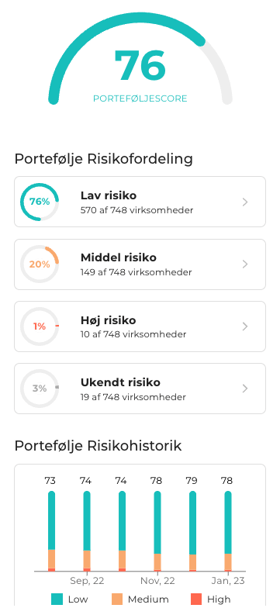
Risika Credit Score
Here, you can dive into your portfolio to understand how your risk is distributed across various parameters—for example, based on industry groups or geography.
You will find a range of views to help you identify trends:
List of Parameters
- Risika Credit Score: Overall distribution of the score within the portfolio.
- Company Type & Number of Employees: View risk distributed by business format and size.
- Geographical Distribution: See where your risk is located on the map.
- Industry Distribution: Identify high-risk industries in your portfolio.
- Development: Track how your portfolio's creditworthiness changes over time.
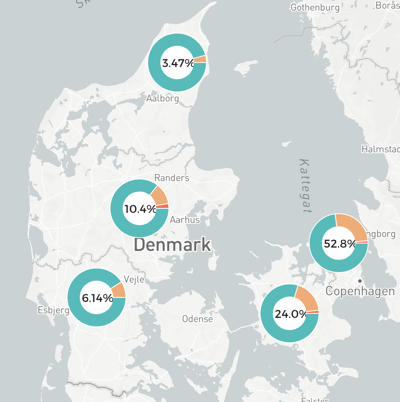
Geographical Overview
Get insight into the portfolio's geographical risk profile. The map shows, for example, if specific regions have a high concentration of companies with low Risika scores (high risk). The module also supports companies from Sweden and Norway.
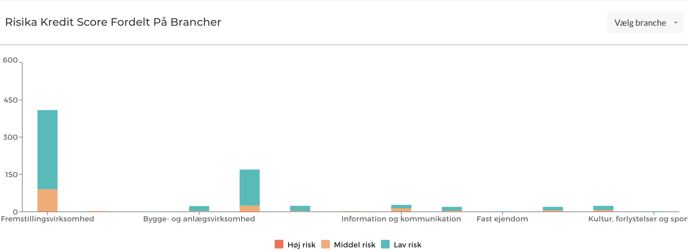
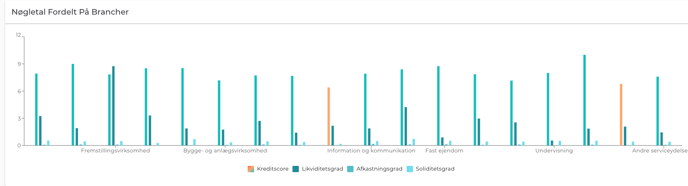
Industry Distribution
This tool provides an overview of the industry groups represented in your portfolio. You can click down into specific sub-industries to gain a detailed understanding of the risk within each category.
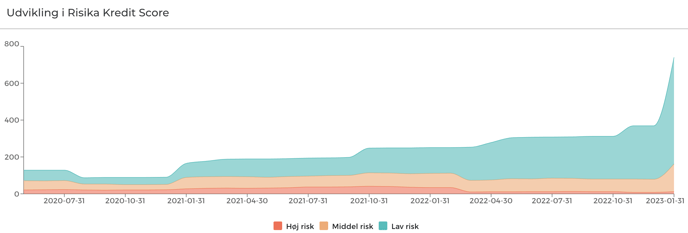
Historical Development
Follow the evolution of your portfolio over time. The graph displays the number of companies divided into three risk groups: High, Medium, and Low. This makes it easy to document if your total portfolio risk is decreasing, even as your number of customers increases.
Financial Performance
The Financial Performance page provides a macro-overview of the portfolio's health through key performance indicators (KPIs) and average calculations:
- Average Figures: View averages for annual results, equity, and employee count.
- KPIs by Industry and Company Type: Compare performance across categories.
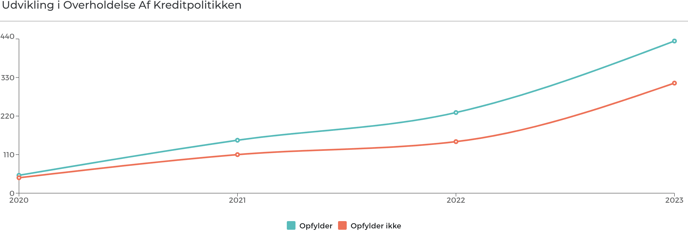
- Credit Policy: See the development of how much of the portfolio complies with your internal guidelines.
Detailed KPIs
By hovering your mouse over an industry or company type, you can see specific averages for Risika score, current ratio, return on investment (ROI), and solvency ratio.
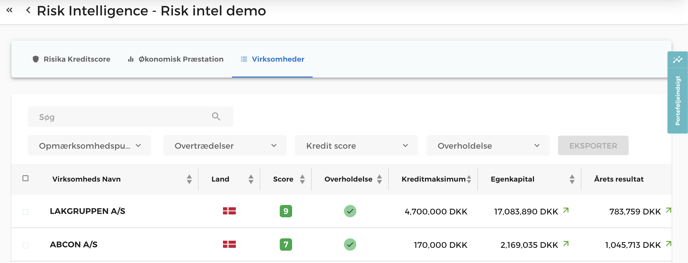
Companies
The Companies tab provides the full list of your portfolio. Here, you can quickly identify which companies comply with or violate your credit policy.
Use the sorting functions to filter the list—for example, if you only want to see "High Risk" companies or those failing a specific point in your credit policy.
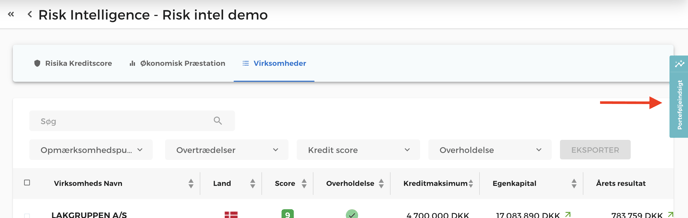
Portfolio Insight
Open the Portfolio Insight section by clicking the blue tab on the right side of the screen.
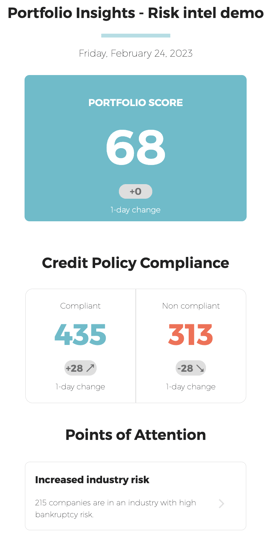
Summary and Portfolio Score
Under "Summary," you will find your overall Portfolio Score. This is a weighted average for your entire list, providing a quick snapshot of the total credit risk.
You also get:
- Risk Distribution: A visual overview of the portfolio.
- Attention Points: A collection of all "warning lights" (e.g., negative remarks) across the list.
- Interactivity: Click on a risk category or an attention point to automatically filter the list and see the relevant companies.
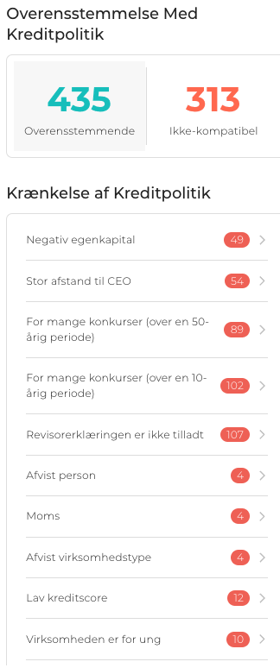
Credit Policy Compliance
Here, you can see exactly where your portfolio challenges your established criteria—for instance, if a company has too many bankruptcies in its history or a rejected signatory rule. Everything here reflects your personal setup in Risika.
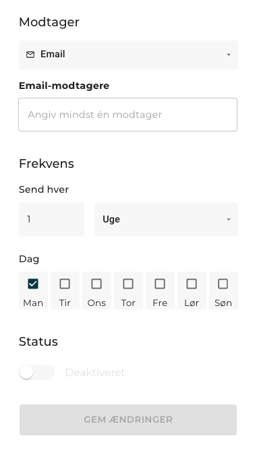
Scheduler (Automatic Updates)
Automate your reporting with the Scheduler. Enter your or your colleagues' email addresses and choose the desired frequency. You will then automatically receive a status report on the portfolio's development and credit policy compliance directly in your inbox.
Help
Do you have questions about Risk Insights or need help getting started? We are ready to assist you via our live chat or email at support@risika.com.